Debugging Arduino sensors with the Serial Plotter
I am a beginner with Arduino. While experimenting with various sensors I eventually came to the point where I wanted to smooth input data in order to get a more steady readings. I found this plotting tool within the Arduino IDE to help me.
Debugging wobbly input data
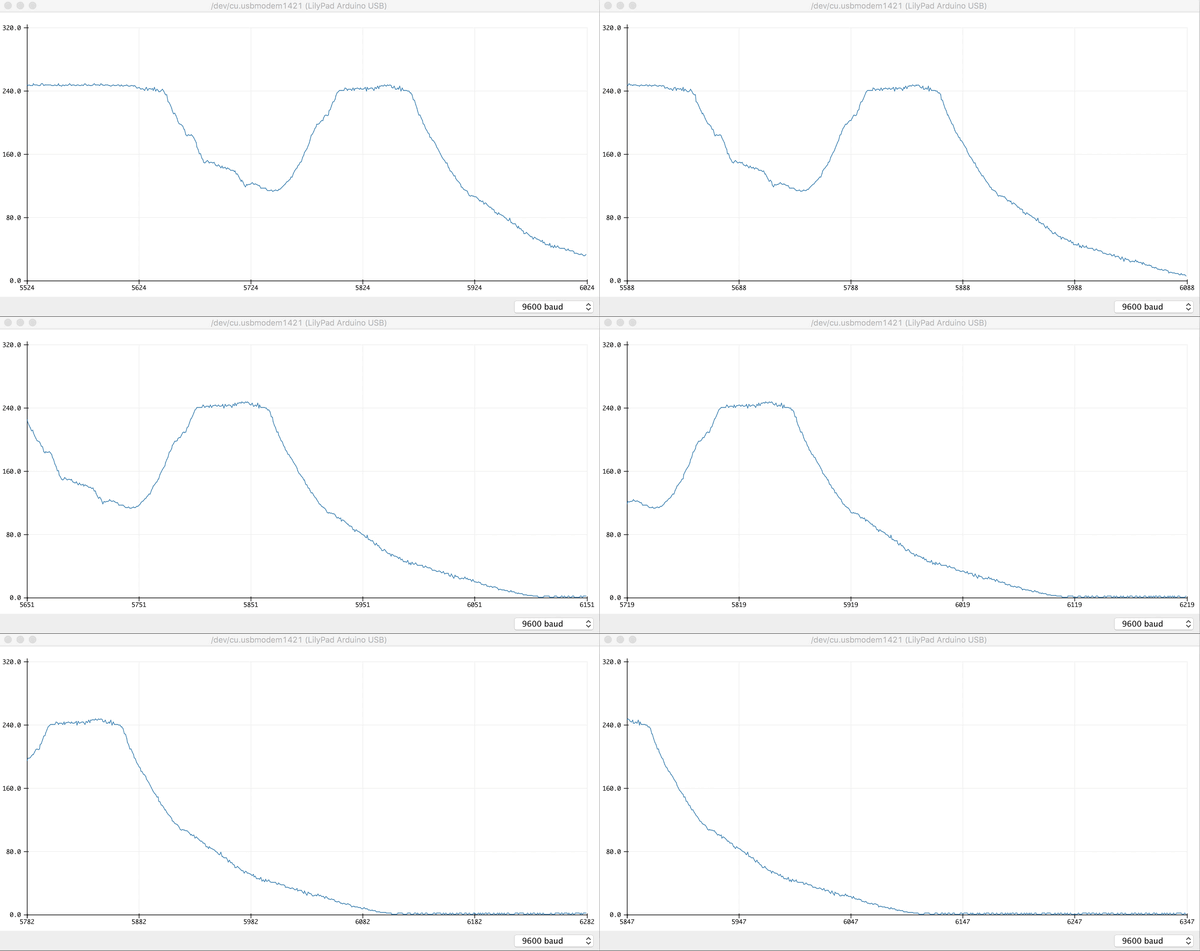
Arduino IDE has a Serial Plotter which is a fantastic debugging tool to complement the raw logging monitor. The original Serial Monitor displays text data only, and while a stream of numbers can be quite useful, pictures are worth a thousand words, or numbers in this case.
As of version 1.6.6 the IDE comes with a built in plotter that accepts a stream of numbers from Serial.println and graphs them over time, auto-scaling the Y-axis to include your highest and lowest sample values.

As a visually-oriented person this made me so happy to find! If you're debugging analog sensor data, I'd highly recommend enabling the plotter to make sense of the readings. It also makes easy work of determining when you have unsteady input, as I had in my previous post. If the plotter shows inconsistent data, producing jagged lines, then perhaps it's time to try input smoothing to achieve a less noisy, smoother line in the plotter.
Multiple inputs
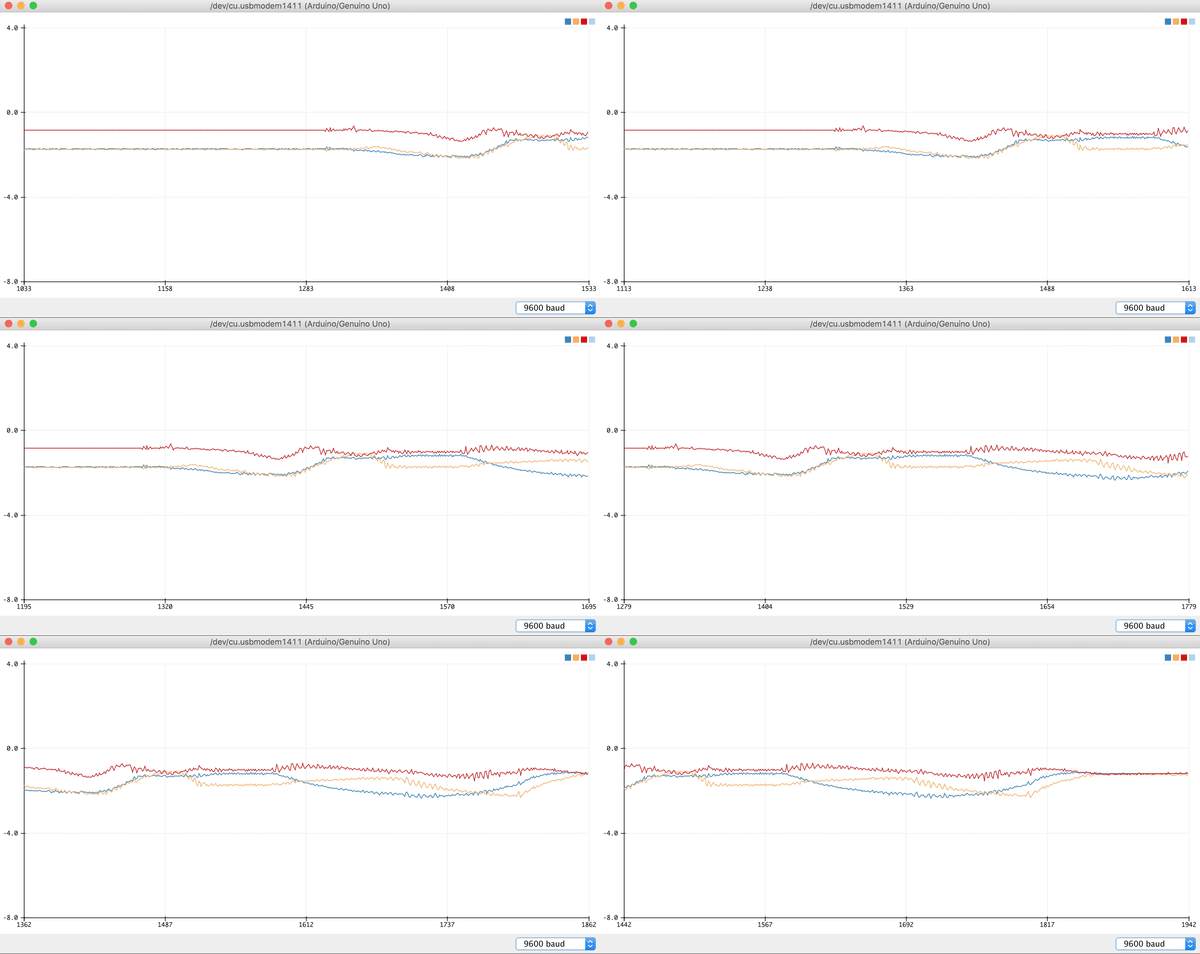
After some more tinkering I stumbled upon the multi-line plotting. It can display multiple inputs of data. The code is quite simple, just use spaces or tabs to separate your data. Values should be printed using Serial.print() instead of Serial.println() which is better for single-value logging.
Here's a simple codeblock that allows the Serial Plotter to display all three signals from a 3-axis accelerometer connected to analog pins A0, A1, and A2:
void setup() {
  Serial.begin(9600);

  pinMode(A0, INPUT); // X
  pinMode(A1, INPUT); // Y
  pinMode(A2, INPUT); // Z
}

void loop() {
  int X = analogRead(A0);
  int Y = analogRead(A1);
  int Z = analogRead(A2);

  Serial.print(X);
  Serial.print("\t");
  Serial.print(Y);
  Serial.print("\t");
  Serial.print(Z);

  Serial.println(); // line-feed
}
I used tabs to separate the values in this example because it improves the formatting of the text-based Serial Monitor too. Here is an animated GIF of the plotter displaying all three values as I wave the accelerometer chip around:
